Lately, I have been developing in JavaScript more than I used to. I have recently discovered the JavaScript functions .map(), .reduce() and .filter(), which are equivalent to my beloved array_map, array_reduce and array_filter in PHP. However, not every browser supports them. They are not supported, for example, by IE8 and I know some of our users still use it.
My current company develops a private web application that holds sensitive data, including personally identifiable information (PII) from thousands of clients. I wanted to do a browser analysis and see how sensible it would be to upgrade the JavaScript on our application so I could use the mentioned functions. We don't have Google Analytics set up and I decided we should not use it. I know Google takes privacy and security seriously, are ISO certified (17021 and 27006) and have controls and procedures to ensure data isn’t accessed by the wrong people. However, using Google Analytics involves having to insert a JavaScript snippet into your web app and that would theoretically give Google the technical opportunity to have this JavaScript code do anything to your site or visitors. The use of any third party script is against our policy.
User Agent String
As our application queries sensitive data from clients, we are supposed to record which user saw which kind of sensitive data and when. We keep this information for 90 days in order to be able to conduct an investigation in case of a data breach, misuse of personal data or malicious access. Our log records the following data on a DB table:
| User ID | ID of the application user that is accessing the information |
| Client ID | ID of the client whose information is being queried |
| Data type | The type of sensitive data that it is being accessed, ie, date of birth, name, address |
| Timestamp | Date and time of information viewing |
| User Agent String | User's browser user agent string |
As you can see, one of the pieces of data we're recording from users is the User Agent String (UA). A user agent string is a string of characters that is sent as an HTTP header by the browser on every request and helps the server identify which browser is being used, what version, and on which operating system, among other things. Here's an example of UA:
Mozilla/5.0 (Windows NT 6.1) AppleWebKit/537.36 (KHTML, like Gecko) Chrome/62.0.3202.94 Safari/537.36There are millions of UA combinations. Every device type (including phones, tablets, desktops), browser or operating system may come with its own UA. Luckily, there are free APIs out there that can help us parse these strings in order to accurrately detect these different items. For the purpose of this simple analysis, I used UserAgentString.com, which is free and there is no need for an API key.
Taking all this into account, we could create a simple reporting project for us to analyse OS and browser usage of our users.
The project
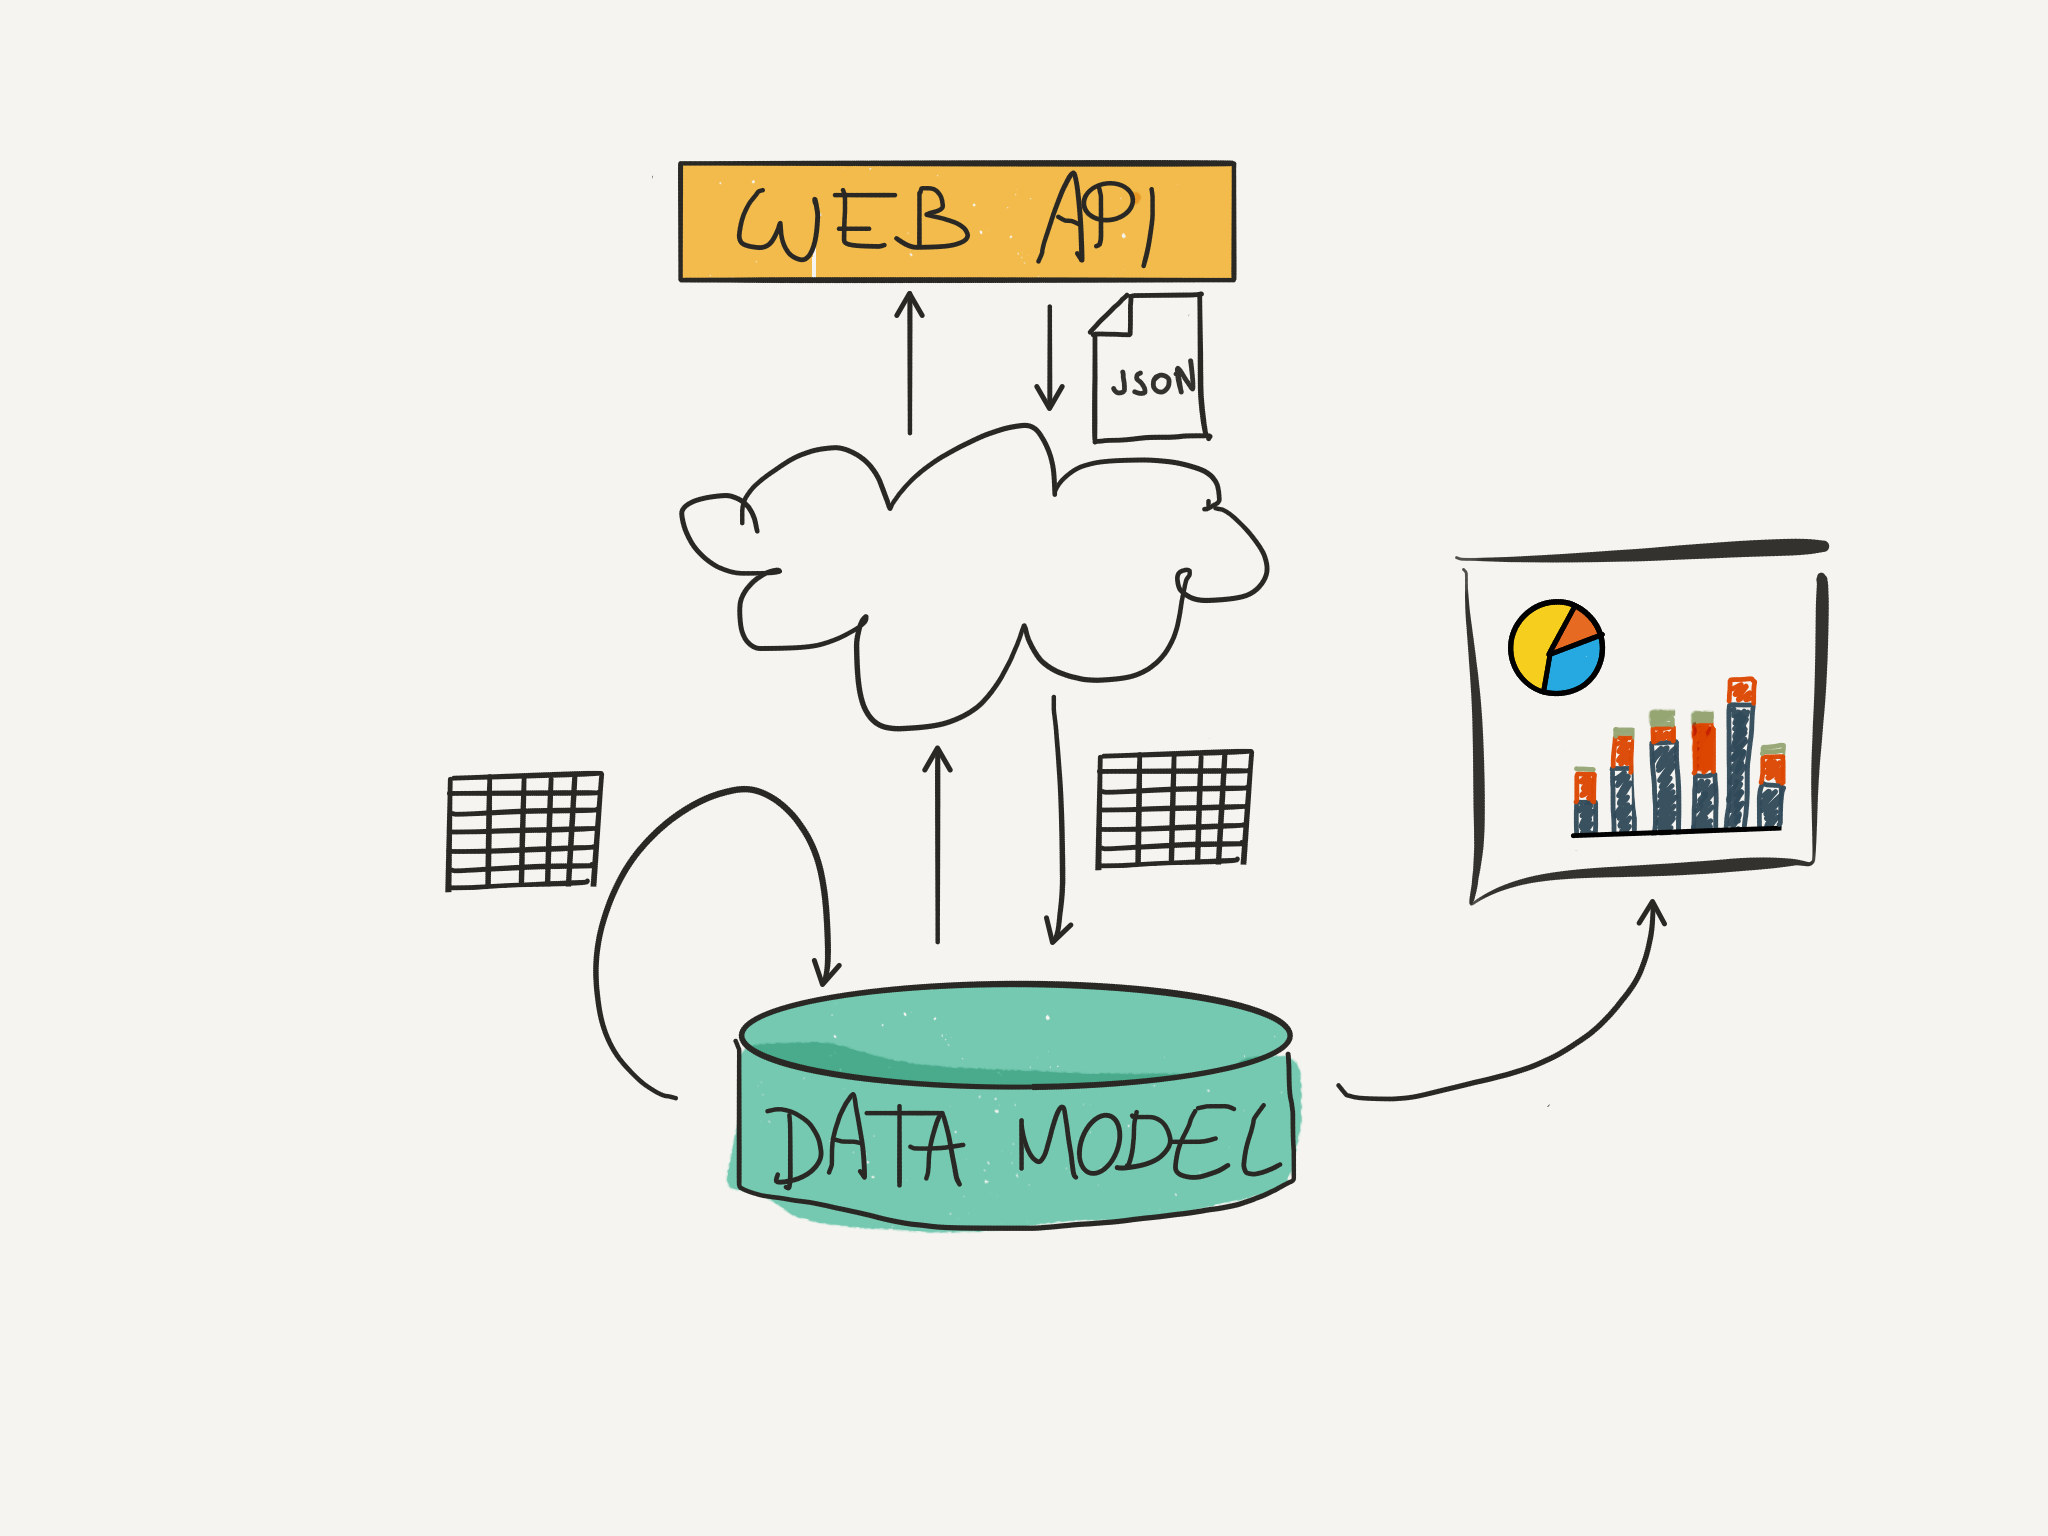
The idea is to create a small project that would help us understand which kind of systems our users have and use to access our platform. The project would use the data we already collect, transform it to enrich its value and present it in a visually atractive way, so it is easy to analise and draw a conclusion. Even though this is a very small project, it could be considered a BI project, given the fact that we are looking to perform data analysis of "business information". Moreover, we are going to use some Data Warehousing concepts.
What we have
As explained above, we have a view log that contains the user agent string of the users that query client's data. This information is collected in our PostgreSQL DB in a table with the following structure:
CREATE TABLE viewlog
(
	view_id SERIAL,
	user_id integer,
	client_id integer,
	data_type character varying(50),
	viewtime timestamp with time zone,
	useragent character varying(400)
);
This table only keeps the data for a period of 90 days so any date older than today - 90 days is automatically cleared by our software.
The field view_id is an auto-incrementing Primary Key that we don't really need for our project. We don't need user_id or client_id which are, as mentioned, fields that (anonymously) identify people. The field data_type is also not relevant to our project. We're then left with viewtime and useragent. We will use useragent to extract our users systems information and the viewtime field can be kept for statistical purposes. However, we don't need the exact time at which any information was queried so we can aggregate these records per day and then count how many times a useragent was used, something like:
-- in PostgreSQL, 'timestamp::date' casts a timestamp as a date, removing the time part

SELECT useragent, viewtime::date, count(*)
FROM viewlog
GROUP BY useragent, viewtime::date;
Also, we can use the API mentioned above to extract more exact information on the browser and OS use. By submitting a user agent string to this API, we can get back specific fields with the OS name, browser name and version. We could enrich our DB with this information and use it on our reporting.
The model
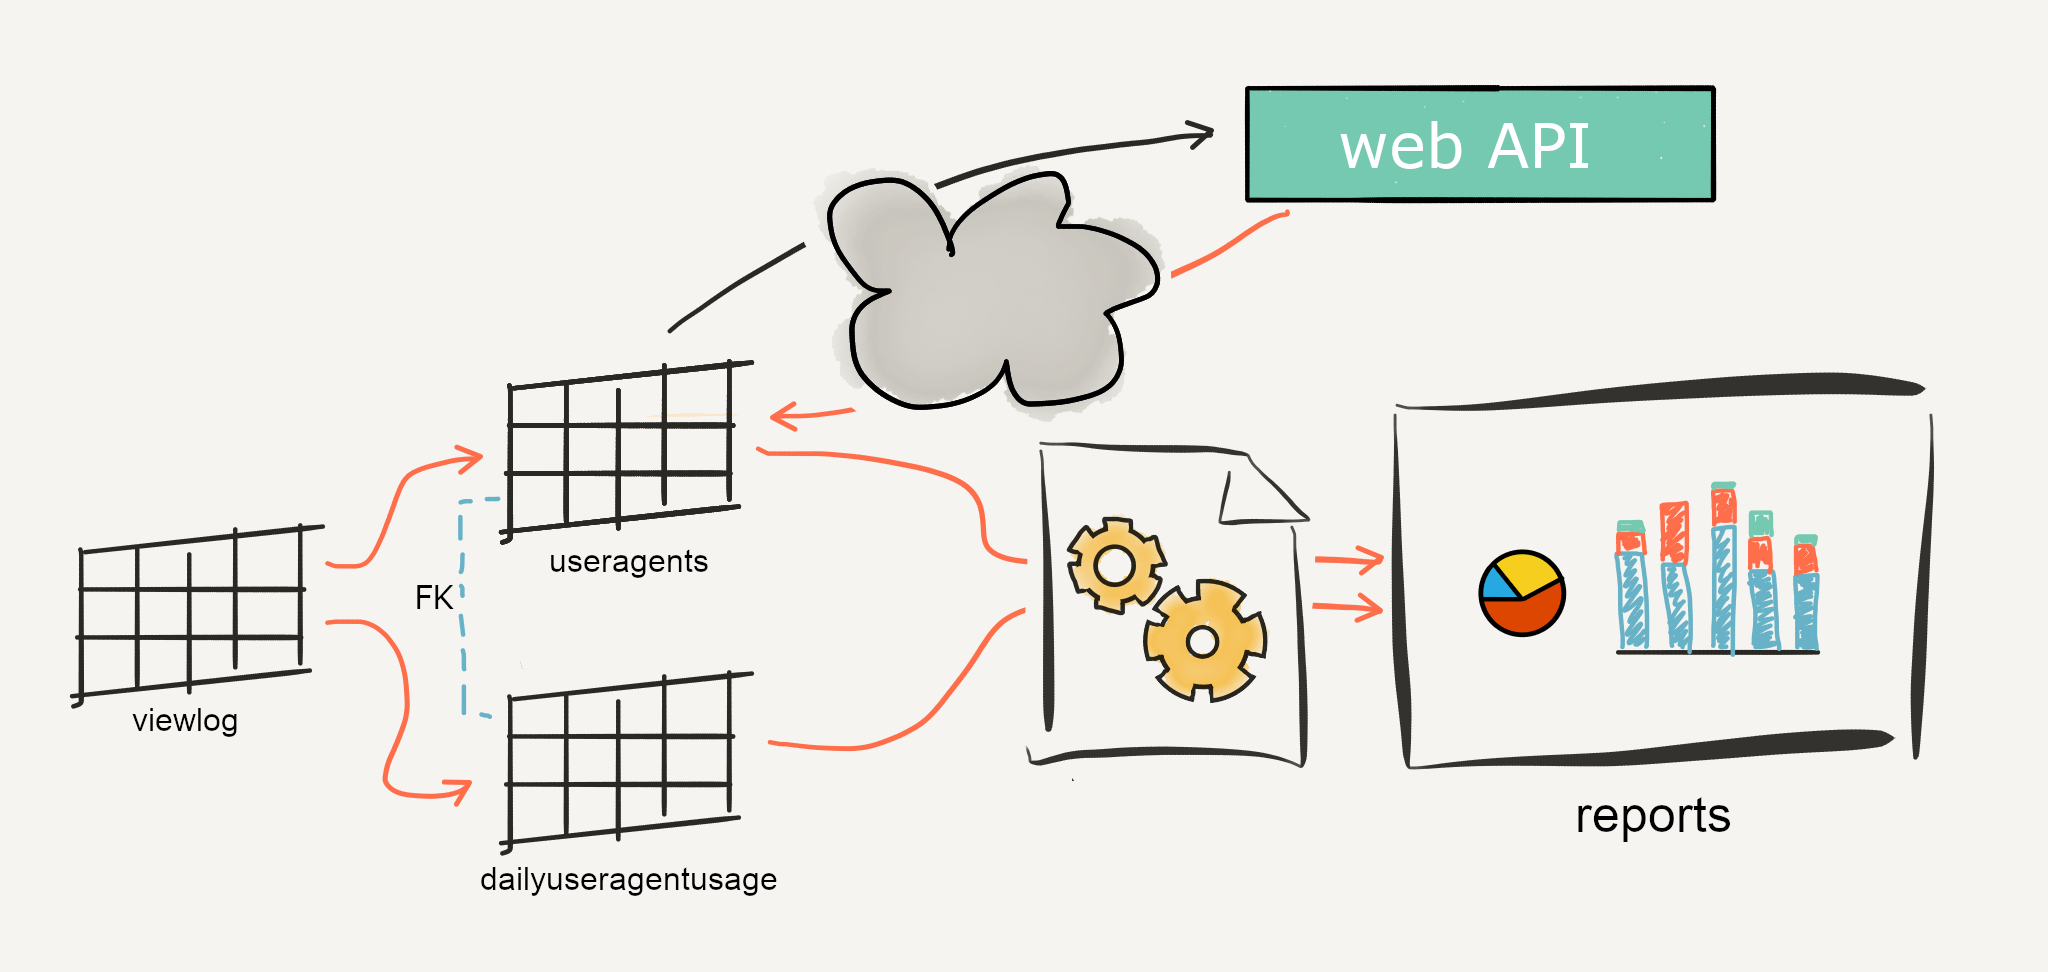
The idea is to copy data from one source (the viewlog table) into a destination system (our model) which represents the data in a different context than the source. This data integration concept is called Extraction, Transformation, Load (ETL) and is the approach used to build Data Warehouses. Our DB model is going to consist of two tables:
CREATE TABLE useragents
(
    id SERIAL PRIMARY KEY,
    ua_string CHARACTER VARYING(400) UNIQUE,
    os_name CHARACTER VARYING(50),
    browser_name CHARACTER VARYING(50),
    browser_version CHARACTER VARYING(50),
    insert_time TIMESTAMP,
    update_time TIMESTAMP
);

CREATE TABLE dailyuseragentuse
(
    id SERIAL PRIMARY KEY,
    useragent_id integer REFERENCES useragents(id) ON DELETE RESTRICT ON UPDATE CASCADE,
    usage_date DATE,
    usage_count INTEGER,
    UNIQUE(useragent_id, usage_date)
);We're going to copy unique user agent strings from to the viewlog table into the useragents table, then enrich that information using the API. Then we'll load the dailyuseragentuse table, by grouping the viewlog by date and user agent string. Lastly, we will use that information to plot a graph to help us visually analise the information.
Let's get to work
Our software, should do the following:
- Periodically load the DB tables
useragentsanddailyuseragentusefromviewlog. - Enrich the
useragentstables by using a web API to decode the useragent string and fill the fieldsos_name,browser_name,browser_version. - Plot, in some kind of data chart, our results to visually analyse them.
Load the DB tables from viewlog can be achieved with the following queries:
INSERT INTO useragents (ua_string, insert_time)
    SELECT useragent, NOW()
    FROM viewlog
    WHERE useragent NOT IN (SELECT ua_string FROM useragents)
    GROUP BY useragent;

INSERT INTO dailyuseragentuse (useragent_id, usage_date, usage_count)
    SELECT ua.id, log.viewtime::date, count(*)
    FROM viewlog log
    INNER JOIN useragents ua ON (log.useragent = ua.ua_string)
    GROUP BY ua.id, log.viewtime::date;
This can be executed on first load, and then we could setup a cron job to periodically upload info depending on the last time this was executed.
Use curl to enrich the useragents table by adding OS and browser info:
<?php

// $dbAgents contains the relevant 'useragents' table records

foreach($dbAgents as $agent){

	$ua = urlencode($agent['ua_string']);
	$ch = curl_init();
	$url = "http://www.useragentstring.com/?uas={$ua}&getJSON=agent_name-agent_version-os_name";
	curl_setopt($ch, CURLOPT_URL, $url);
	curl_setopt($ch, CURLOPT_RETURNTRANSFER, TRUE);

	$apiResult = json_decode(curl_exec($ch));
	$http = curl_getinfo($ch, CURLINFO_HTTP_CODE);
	curl_close($ch);

	// update the 'useragents' table with the fields
	// $apiResult->agent_name, $apiResult->agent_version and $apiResult->os_name
}
To plot a graph, we'll use D3 to develop a simple bubble graph and help us see OS and browser usage.
Server side
Let's consider the following simple class to deal with DB connections:
<?php

/*
 * This is not production-quality code.
 * It has been optimized for readability and understanding.
 */

class DbConnect
{
    protected $db;

    public function __construct(\PDO $db)
    {
        $this->db = $db;
    }

    public function runQuery($query, $parameters = null)
    {
        $stmt = $this->db->prepare($query, $parameters);
        $stmt->execute($parameters);
        return $stmt;
    }

    protected function runSelectQuery($query, $parameters = null)
    {
        $stmt = $this->runQuery($query, $parameters);
        return $stmt->fetchAll();
    }
}
Then, the following class could deal with the first steps of loading the DB tables:
<?php

/*
 * This is not production-quality code.
 * It has been optimized for readability and understanding.
 */

class UsageStatsLoader
{
	protected $dbConnect;

    public function __construct(DbConnect $dbConnect)
    {
        $this->dbConnect = $dbConnect;
    }

    public function loadTables()
    {
        $lastLoadDate = $this->getLastDate();
        // Delete the usage data of the last recorded date, to cover for that usage
        // done on the same day of the last recorded date but after this load was executed.
        $this->deleteUsageFromDate($lastLoadDate);
        $this->loadUserAgentFromDate($lastLoadDate);
        $this->loadUsageFromDate($lastLoadDate);
    }

    protected function getLastDate()
    {
        $recordSet = $this->dbConnect
            ->runSelectQuery("SELECT MAX(usage_date) as lastdate FROM dailyuseragentuse;");

        return $recordSet['lastdate'];
    }

    protected function deleteUsageFromDate($lastDate)
    {
        $this->dbConnect->runQuery(
            "DELETE FROM dailyuseragentuse WHERE usage_date >= :lastdate;",
            [':lastdate' => $lastDate]
        );
    }

    protected function loadUserAgentFromDate($lastDate)
    {
        $this->loadNewUserAgentStrings($lastDate);
        $this->updateUserAgentInfo();
    }

    protected function loadNewUserAgentStrings($lastDate)
    {
        $this->dbConnect->runQuery(
            "INSERT INTO useragents (ua_string, insert_time)
            SELECT DISTINCT useragent, NOW()
            FROM viewlog
            WHERE viewtime >= :lastdate
            AND useragent NOT IN (SELECT ua_string FROM useragents)
            GROUP BY useragent;",
            [':lastdate' => $lastDate]
        );
    }

    protected function loadUsageFromDate($lastDate)
    {
        $this->dbConnect->runQuery(
            "INSERT INTO dailyuseragentuse (useragent_id, usage_date, usage_count)
            SELECT ua.id, log.viewtime::date, count(*)
            FROM viewlog log
            LEFT JOIN useragents ua ON (log.useragent = ua.ua_string)
            WHERE viewtime >= :lastdate
            GROUP BY ua.id, log.viewtime::date;",
            [':lastdate' => $lastDate]
        );
    }

    protected function updateUserAgentInfo()
    {
        $dbAgents = $this->dbConnect->runSelectQuery(
            "SELECT ua_string FROM useragents WHERE update_time IS NULL;"
        );

        foreach($dbAgents as $agent){

            $ua = urlencode($agent['ua_string']);
            $ch = curl_init();
            $url = "http://www.useragentstring.com/?uas={$ua}&getJSON=agent_name-agent_version-os_name";
            curl_setopt($ch, CURLOPT_URL, $url);
            curl_setopt($ch, CURLOPT_RETURNTRANSFER, TRUE);

            $apiResult = json_decode(curl_exec($ch));
            $http = curl_getinfo($ch, CURLINFO_HTTP_CODE);
            curl_close($ch);

            $this->dbConnect->runQuery(
                "UPDATE useragents
                SET os_name = :osname, browser_name = :browsername,
                    browser_version = :browserversion, update_time = NOW()
                WHERE ua_string = :uas;",
                [
                    ':osname' => $apiResult->agent_name,
                    ':browsername' => $apiResult->agent_version,
                    ':browserversion' => $apiResult->os_name,
                    ':uas' => $agent['ua_string']
                ]
            );

        }
    }
}
Given this, a cron job could be used to execute UsageStatsLoader::loadTables() every Sunday (the day of least activity of our app). This would ensure that our stats are updated enough and that we won't lose old usage data due to the viewlog table being cleared every 90 days.
Our model contains now the data, ready to be queried. This data is non-volatile, ie, we won't need to manually update/edit, delete or create new records. Historical data will be kept and will only be used for informational purposes.
To query this data, we could use a simple controller script to receive a GET request with the following parameters: system type (either browser or OS), and date range ("from" and "to" dates). Then, the controller would return a json string with the desired data:
<?php

/*
 * This is not production-quality code.
 * It has been optimized for readability and understanding.
 */

 /* ... */

$dbConnect = new DbConnect($db);

if($_GET['systemtype'] == 'browser')
{
    $fieldString = "CONCAT(browser_name, '', COALESCE(browser_version, '')) AS name";
}
else
{
    $fieldString = "os_name AS name";
}

$usageData = $dbConnect->runSelectQuery(
    "SELECT {$fieldString}, SUM(usage_count) AS count
    FROM dailyuseragentuse duse
    LEFT JOIN useragents ua ON (duse.useragent_id = ua.id)
    WHERE duse.usage_date BETWEEN :datefrom AND :dateto
    GROUP BY name;",
    [':datefrom' => $_GET['from'] , ':dateto' => $_GET['to']]
);

echo json_encode($usageData);
Client side
The main target of any informational system is reporting, used for decision support. Visual analysis is the simplest systematic approach for making decisions. On the client side we are going to develop a simple end-user reporting tool. We only need a page to display a form with the required parameters and asynchronously send a request with them. Then, the JSON data received will be used to render a bubble graph.
In order to make things as simple as possible and make my life easier, I've used a bunch of external things, like Bootstrap to display a nice enough form, jQuery to make the AJAX call and jQuery UI to display datepickers. Lastly, I have developed a simple D3 graph. D3 is a JavaScript library for creating visual representations of data. It is very powerful and the web is full of examples.
<!DOCTYPE html>
<html lang="en">
<head>
	<meta charset="utf-8">
		<title>Browser and OS usage report</title>
		<script type="text/javascript" src="https://d3js.org/d3.v4.min.js"></script>
        <link rel="stylesheet" href="https://maxcdn.bootstrapcdn.com/bootstrap/3.3.7/css/bootstrap.min.css" integrity="sha384-BVYiiSIFeK1dGmJRAkycuHAHRg32OmUcww7on3RYdg4Va+PmSTsz/K68vbdEjh4u" crossorigin="anonymous">
        <link rel="stylesheet" href="//code.jquery.com/ui/1.12.1/themes/base/jquery-ui.css">
        <script src="https://code.jquery.com/jquery-1.12.4.js"></script>
        <script src="https://code.jquery.com/ui/1.12.1/jquery-ui.js"></script>
</head>
<body>
<nav class="navbar navbar-fixed-top">
      <div class="container">
        <div class="navbar-header">
          <a class="navbar-brand">Usage report</a>
        </div>
        <div id="navbar" class="navbar-collapse collapse">
        <form id="usageStatsForm" class="navbar-form navbar-left" role="search">
            <div class="form-group">
                <select name="usageparam" class="form-control">
                    <option>Browser</option>
                    <option>OS</option>
                </select>
            </div>
            <div class="form-group">
                <input name="from" type="text" class="form-control date" placeholder="from">
                <input name="to" type="text" class="form-control date" placeholder="to">
            </div>
            <button type="submit" class="btn btn-default">Submit</button>
        </form>
        </div>
      </div>
    </nav>
    <svg id="chart"></svg>
	<script type="text/javascript">

        $(document).ready(function(){
        $("#usageStatsForm").submit(function(event){
            event.preventDefault();
            $.ajax(
                {
                    url: "/usagedata",
                    data: $("#usageStatsForm").serialize(),
                    success: function(response){
                        drawBubleChart({ children : response });
                    }
                });
            });
        });

        function drawBubleChart(dataset) {
            var diameter = 800;
            var color = d3.scaleOrdinal(d3.schemeCategory10);
            var totalUsage = dataset.children.reduce(
                function(sum, current) { return sum + parseInt(current.count); }, 0);

            var bubble = d3.pack(dataset)
                .size([diameter, diameter])
                .padding(1);

            var svg = d3.select("#chart")
                .attr("width", diameter)
                .attr("height", diameter)
                .attr("class", "bubble");

            var nodes = d3.hierarchy(dataset)
                .sum(function(d) { return d.count; });

            var node = svg.selectAll(".node")
                .data(bubble(nodes).descendants())
                .enter()
                .filter(function(d){
                    return  !d.children
                })
                .append("g")
                .attr("class", "node")
                .attr("transform", function(d) {
                    return "translate(" + d.x + "," + d.y + ")";
                });

            node.append("title")
                .text(function(d) {
                    return d.data.name + ": " + d.data.count;
                });

            node.append("circle")
                .attr("r", function(d) {
                    return d.r;
                })
                .style("fill", function(d,i) {
                    return color(i);
                });

            node.append("text")
                .attr("dy", ".2em")
                .style("text-anchor", "middle")
                .text(function(d) {
                    return d.data.name.substring(0, d.r / 3);
                })
                .attr("font-family", "sans-serif")
                .attr("font-size", function(d){
                    return d.r/5;
                })
                .attr("fill", "white");

            node.append("text")
                .attr("dy", "1.3em")
                .style("text-anchor", "middle")
                .text(function(d) {
                    return Math.round(d.data.count / totalUsage * 10000) / 100 + "%";
                })
                .attr("font-family",  "sans-serif")
                .attr("font-size", function(d){
                    return d.r/5;
                })
                .attr("fill", "white");

            d3.select(self.frameElement)
                .style("height", diameter + "px");
        }
    </script>
    <script>
        $(function() { $(".date" ).datepicker(); });
    </script>
    <script src="https://maxcdn.bootstrapcdn.com/bootstrap/3.3.7/js/bootstrap.min.js" integrity="sha384-Tc5IQib027qvyjSMfHjOMaLkfuWVxZxUPnCJA7l2mCWNIpG9mGCD8wGNIcPD7Txa" crossorigin="anonymous"></script>
</body>
</html>Results
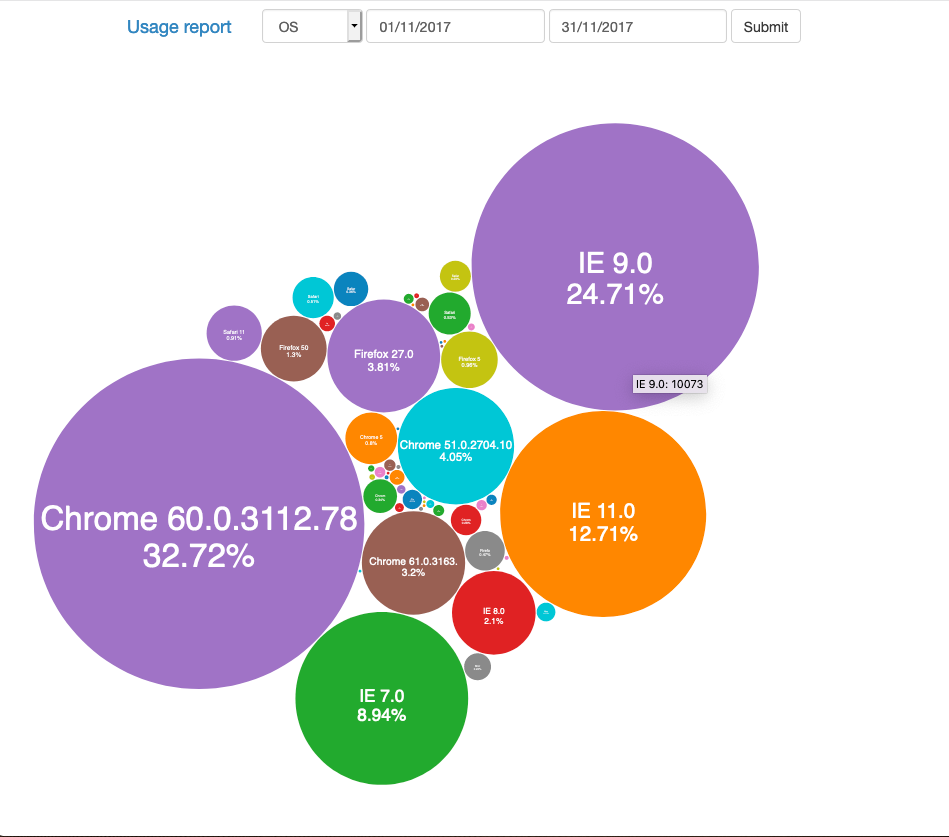
After executing this report for the month of November this year, I got the report below. Most browser usage is done in Chrome, being pretty much up to date in version. After that we have IE9 as the second most used browser. IE11 and IE 7 follow the ranking. As we can observe, Internet Explorer users don't upgrade their software often, which may be due to the fact that our users belong to institutios which often don't allow users manage their own systems. As we can see in the below graph, IE7 is still used in a 9% of cases, a number high enough to consider holding off the JavaScript upgrade we intended to do. Perhaps we could use the information we held in the view log to try and target the IE7 users for an email campaign recomending them to upgrade their systems.
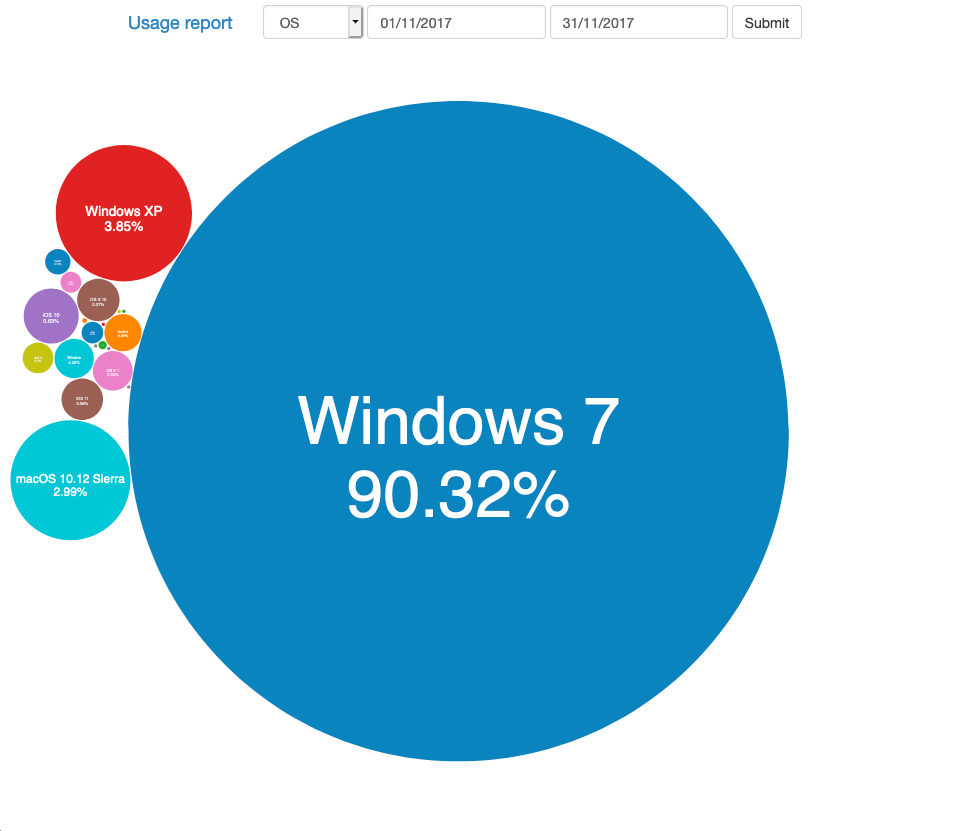
When it comes to operating systems, Windows 7 overwhelmingly wins over the rest of the OS with more than 90% of usage being from Windows 7. As a curious note, there is a fair amount of users that use our application from mobile devices, even though it is not responsive yet, so it is not comfortable to see from a mobile phone.
Conclusion
It looks like we will be putting off the JavaScript update. However, I hope that with this project, readers have learned a bit about the user agent string and some basic principles of informational platforms. I have enjoyed combining the knowledge I earned in my first job as a BI developer, with the web engineering discipline to which I now dedicate myself.